Steps to Use Sorting Controls
Access the Sort By Menu
- Open your Dashboard.
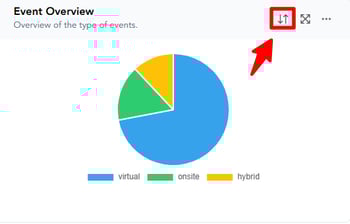
- On each graph, locate the Sort By icon next to the Expand (resize) icon.
- Click the Sort By icon to open the sorting menu.
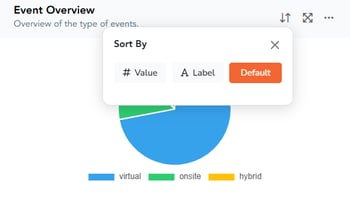
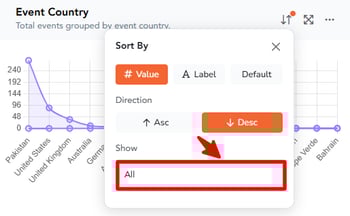
Sorting Options Explained
1. Sort Type
Choose how you want the graph data arranged:
- Value: Sorts data numerically by metric value.
- Date: Sorts data chronologically.
- Default: Resets to the system-defined default order.
2. Sort Direction
Available for Value and Date sorts:
- Ascending (ASC): From smallest to largest / oldest to newest
- Descending (DESC): From largest to smallest / newest to oldest
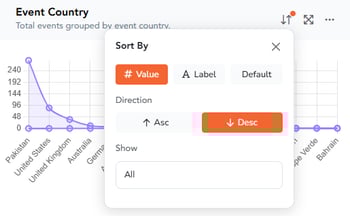
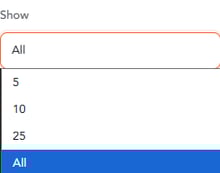
3. Show Options (Top Items)
When a sorting option (Value or Date) is applied, an additional filter appears:
- Top 5
- Top 10
- Top 25
- All
These options allow you to quickly display only the most relevant entries.
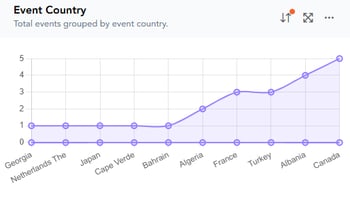
Outcome
Once sorting is applied, the graph will update dynamically and reflect your selected preferences. Your sorting choices will remain in effect even after refreshing the page.
What You Need to Know
- Sorting preferences are retained across page refreshes.
- Sorting options allow you to quickly focus on the most relevant data points for analysis.