Step 1: From the expanded Analytics menu, head over to Reporting360, click on Dashboard.
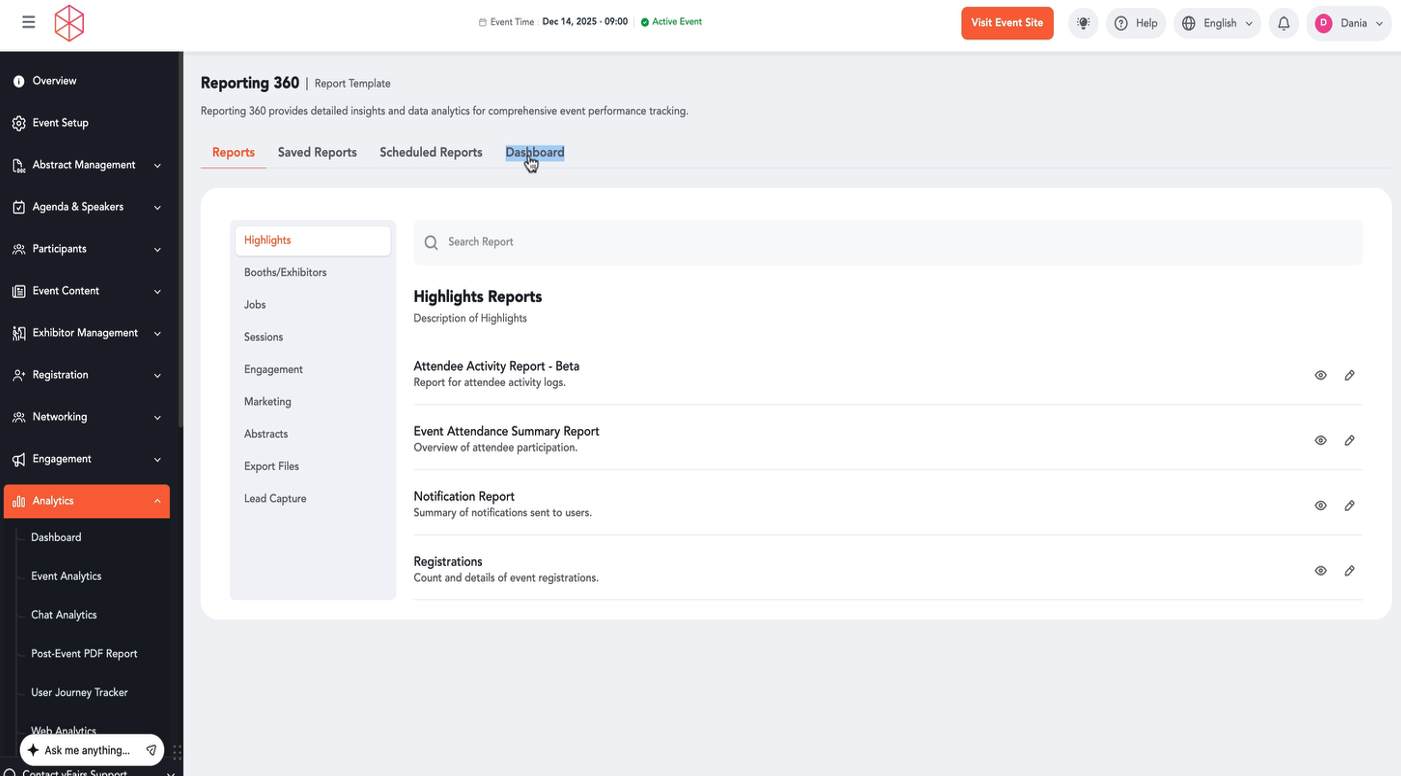
Step 2: You will land on the Reporting 360 page. Click on the Dashboard tab to access the custom reporting dashboard.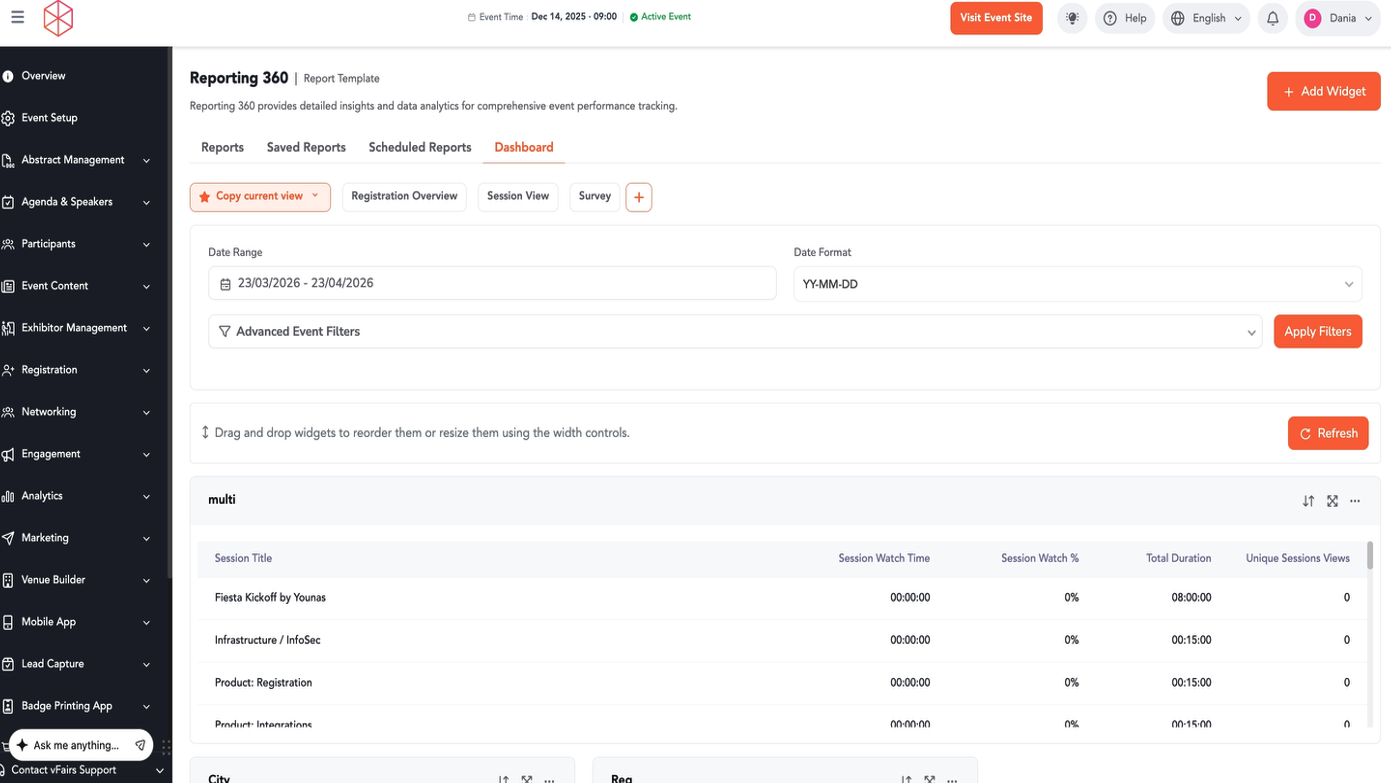
Step 3: To add a new widget to your dashboard, click the + Add Widget button located in the top right corner.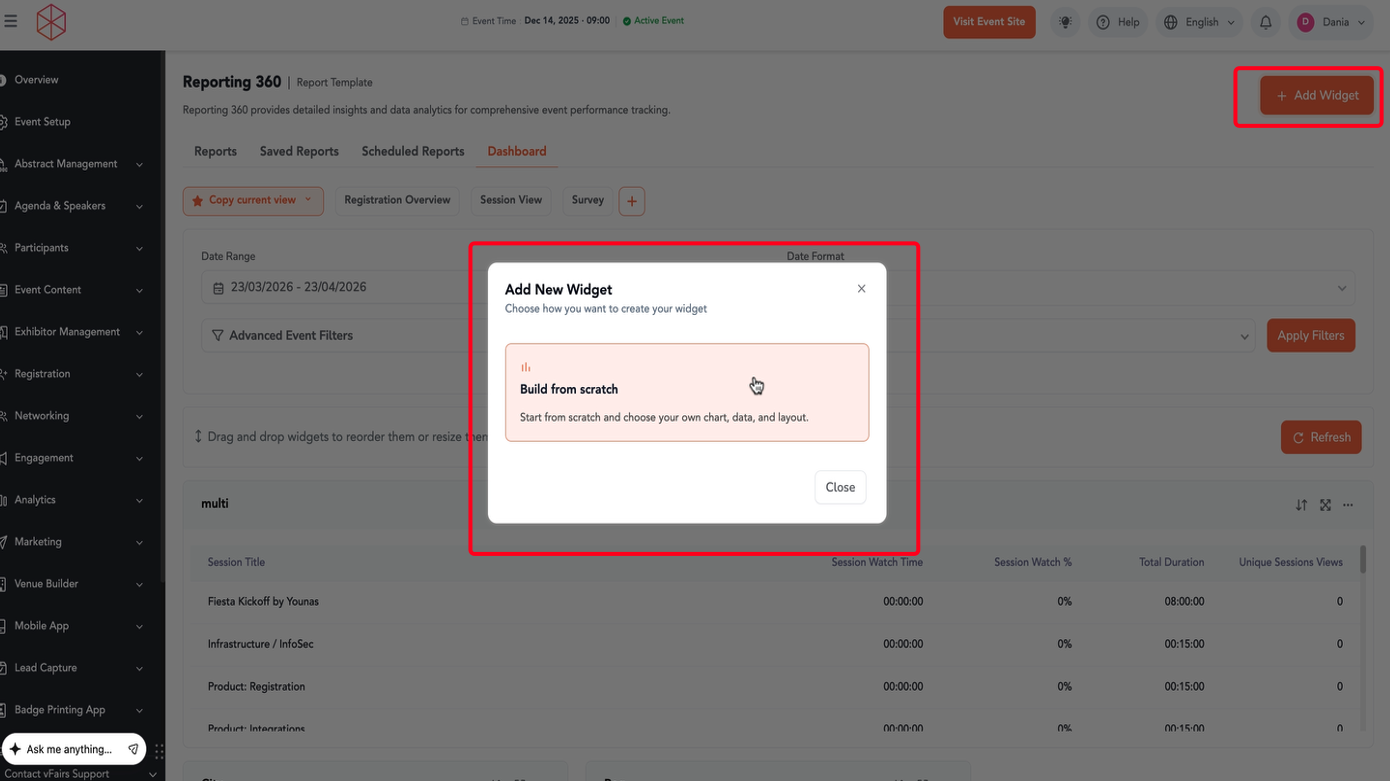
Step 4: In the "Add New Widget" pop-up, select Build from scratch to create a custom visualization.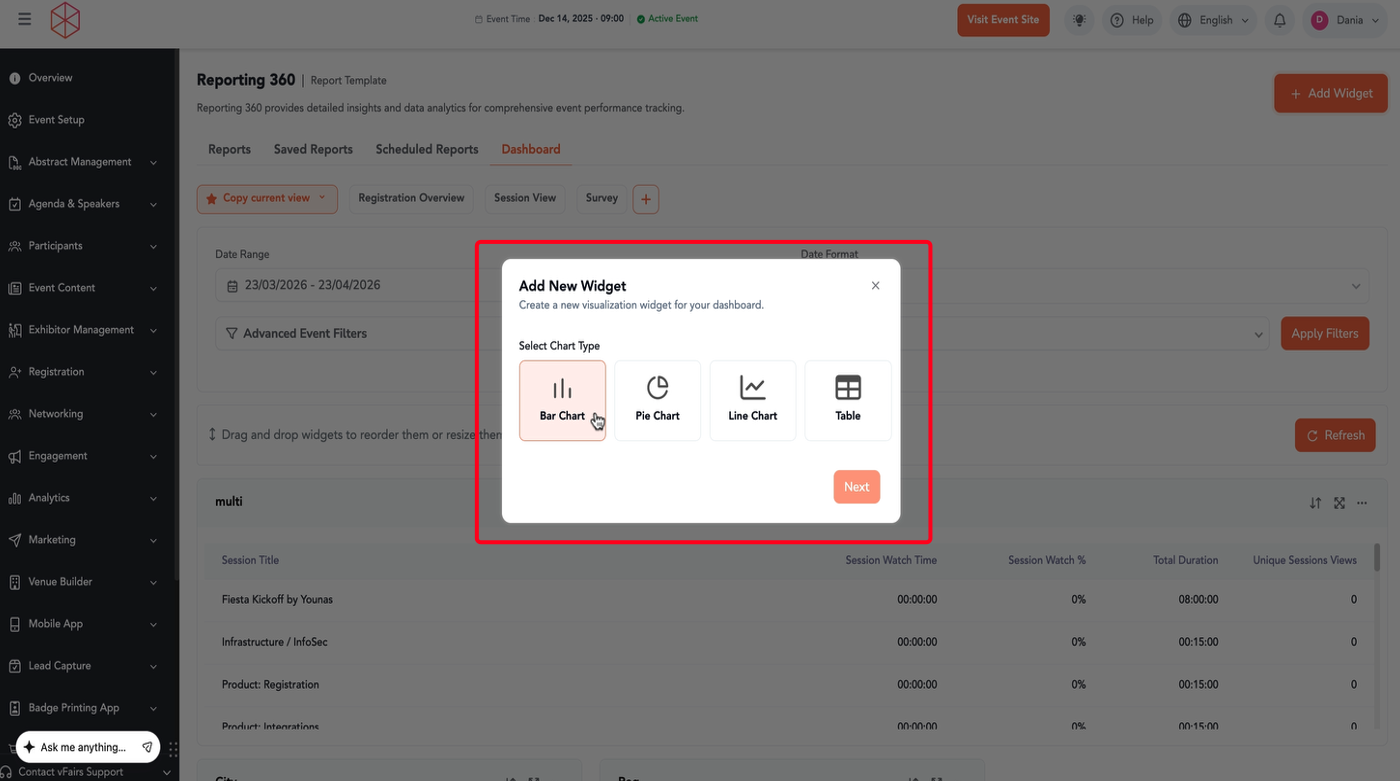
Step 5: Choose your desired Chart Type (e.g., Bar Chart, Pie Chart, Live Chart, or Table). Then click Next.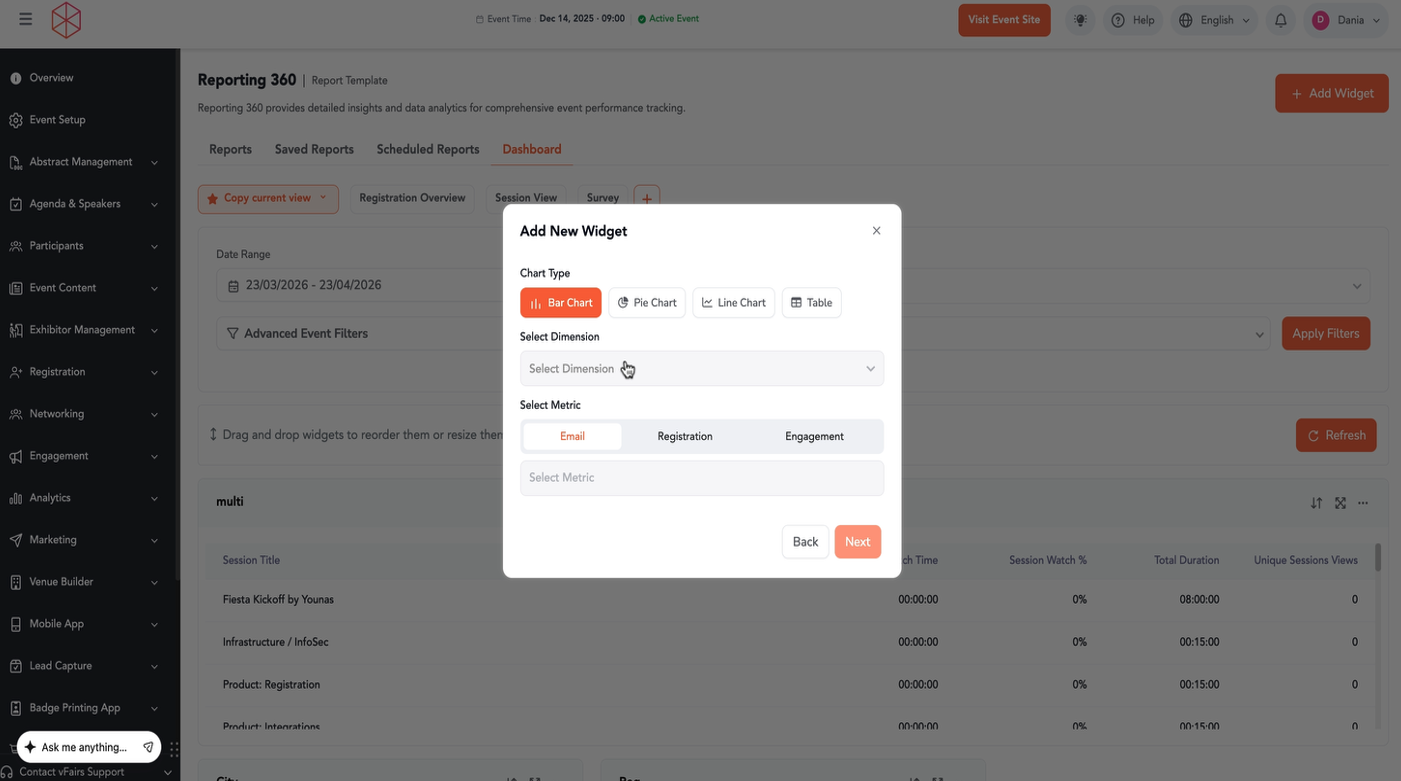
Step 6: Select a Dimension from the dropdown menu. This will define what data category your widget focuses on.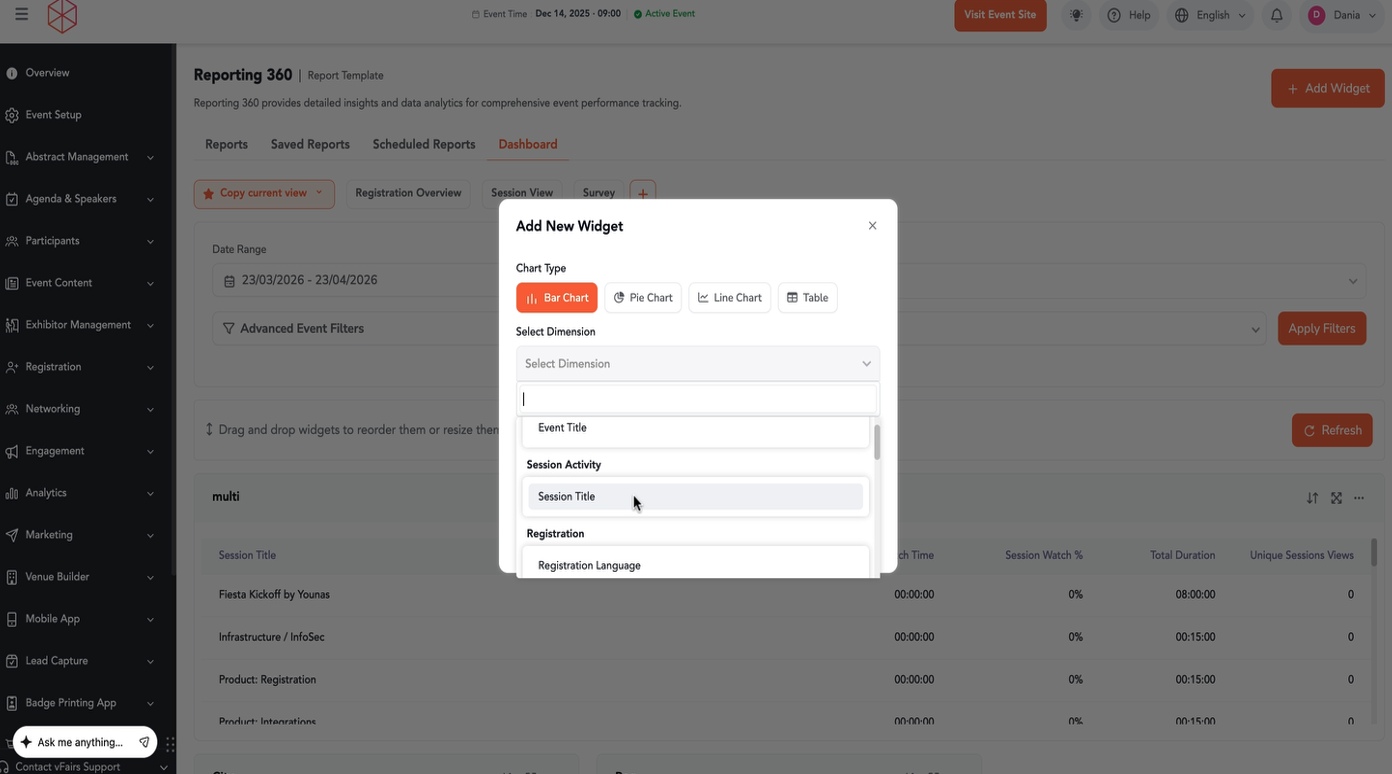
Step 7: Select one or more Metric options. These are the specific data points you want to measure within your chosen dimension.
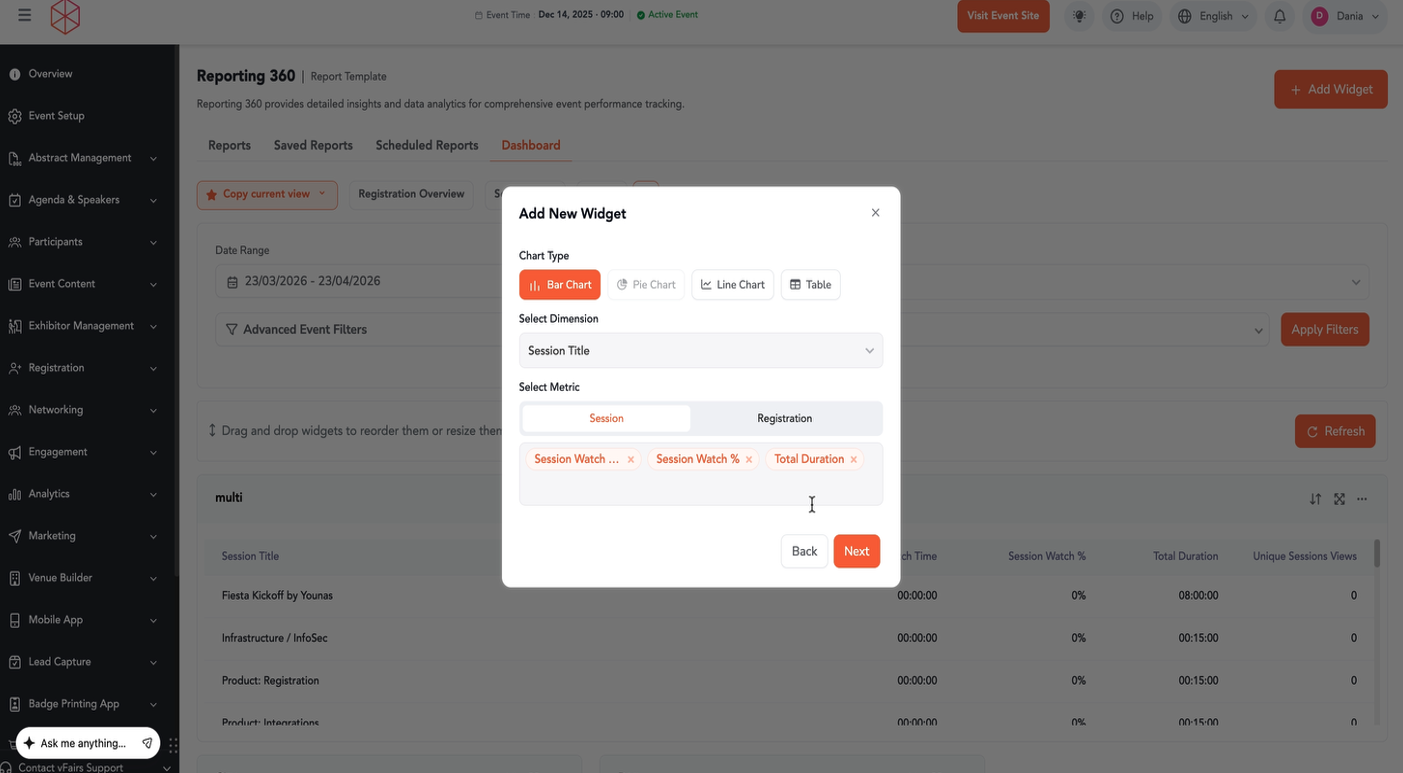
Step 8: Click Next to proceed.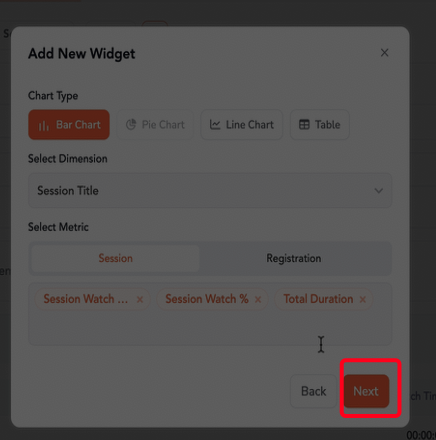
Step 9: Enter a Widget Title and an optional Widget Description. Click Add Widget to finalize and add it to your dashboard.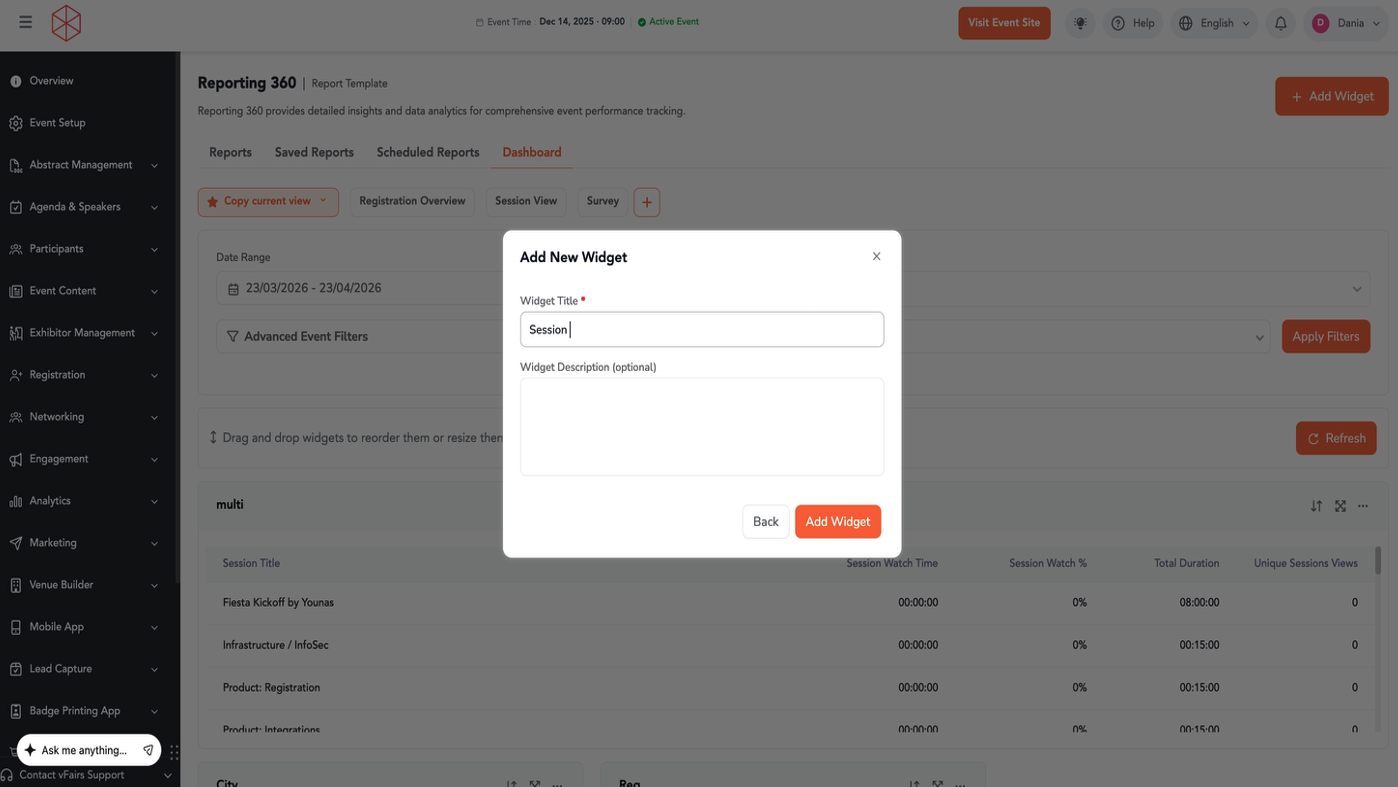
Step 10: To apply filters to your dashboard data, click on Advanced Event Filters.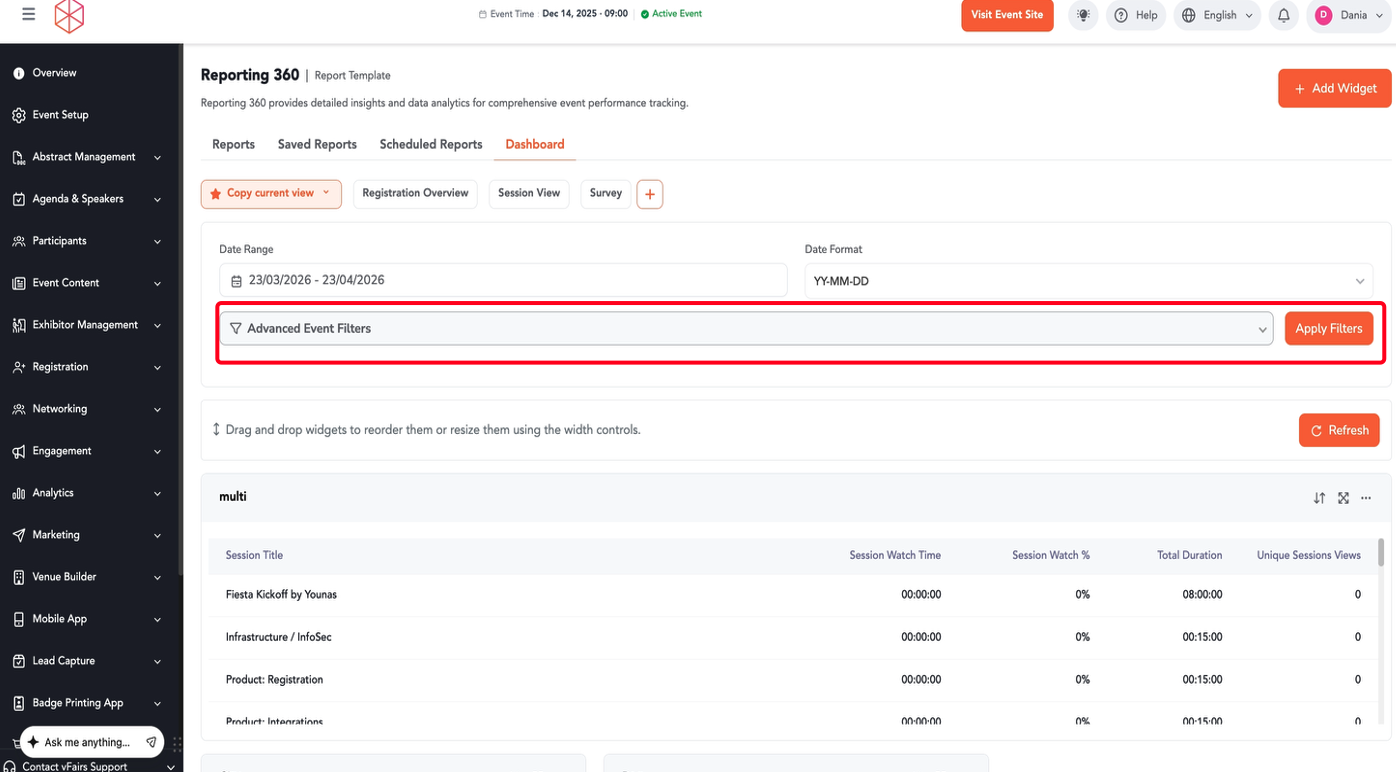
Step 11: Click + Add Criteria to add a new filtering condition.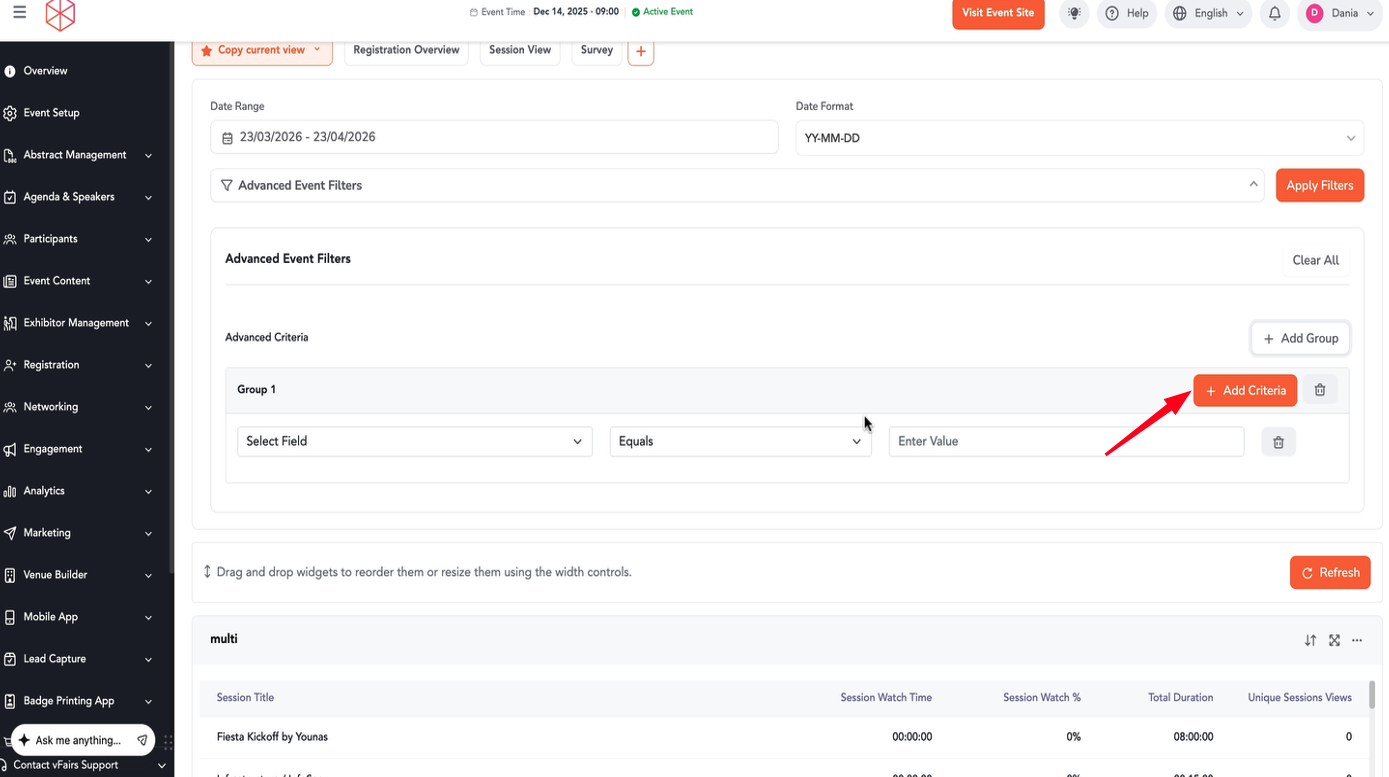
Step 12: Once your filters are set, click Apply Filters to update the dashboard data.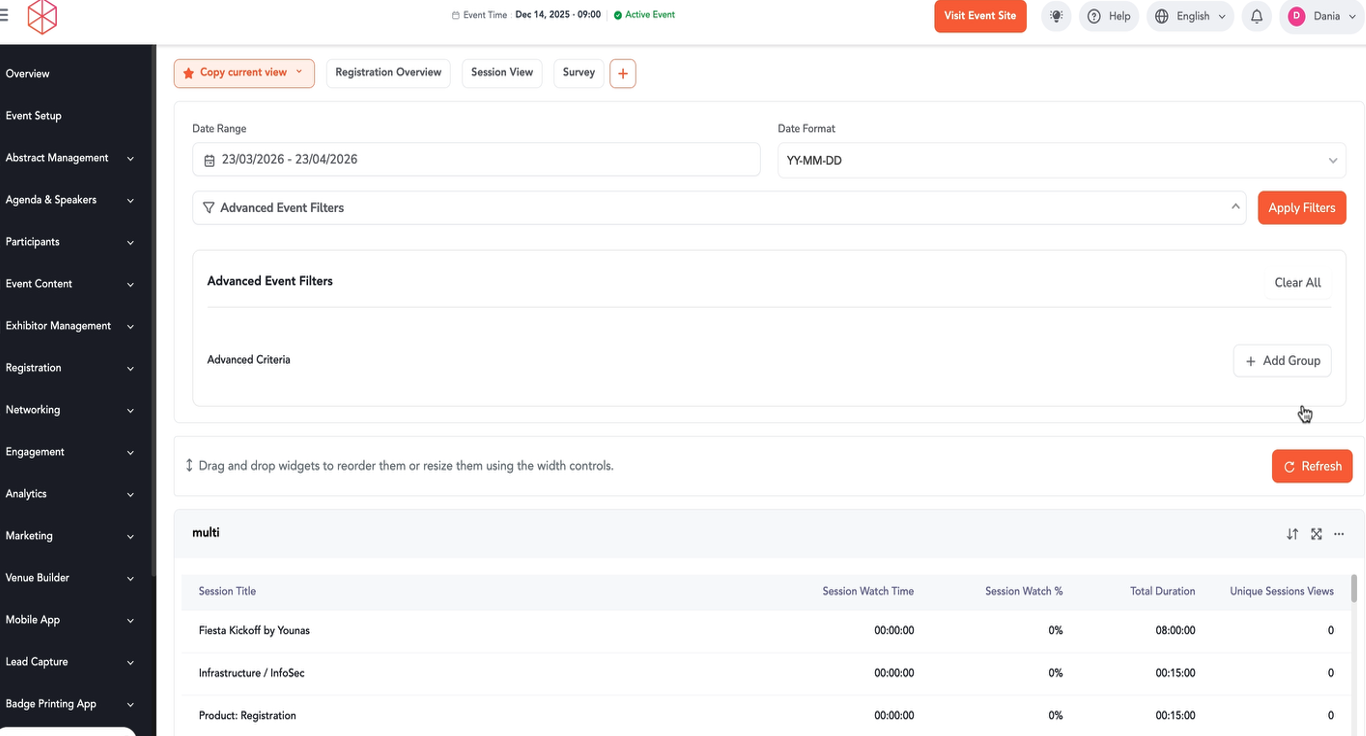
Step 13: To create a new dashboard view, click the + button next to the existing view tabs (e.g., "Survey").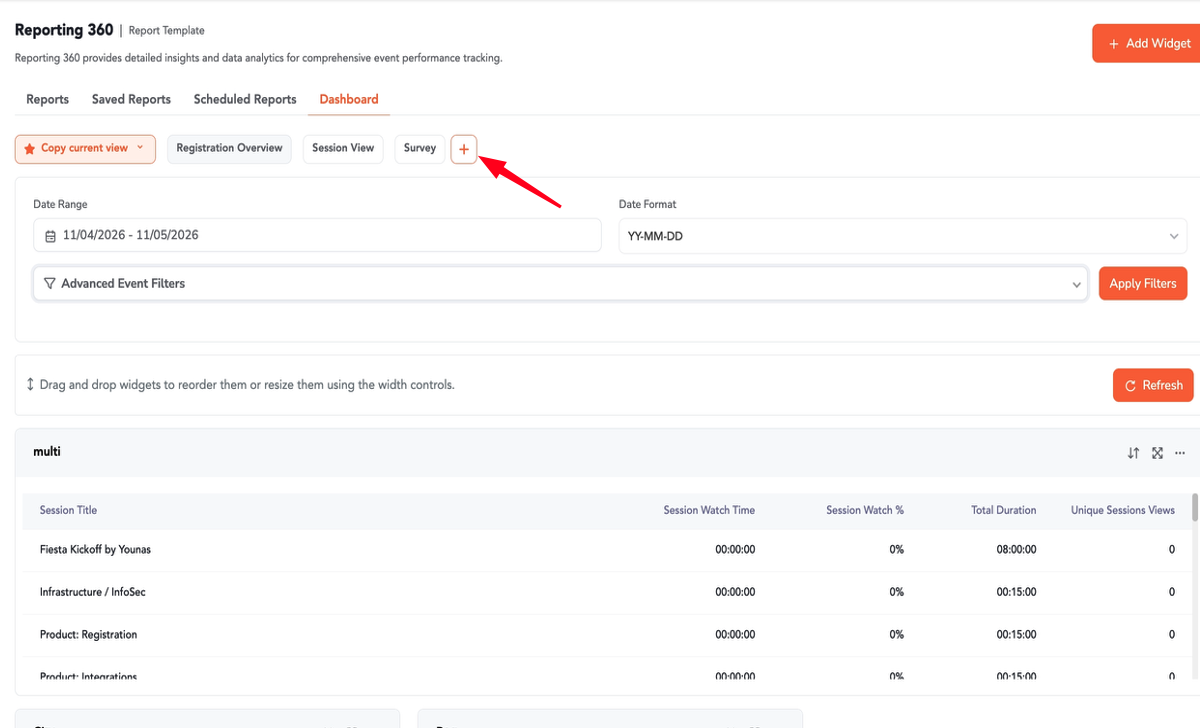
Step 14: In the "Create New View" pop-up, enter a View Name. Choose whether to Start with Blank or Copy Current View. Click Create View.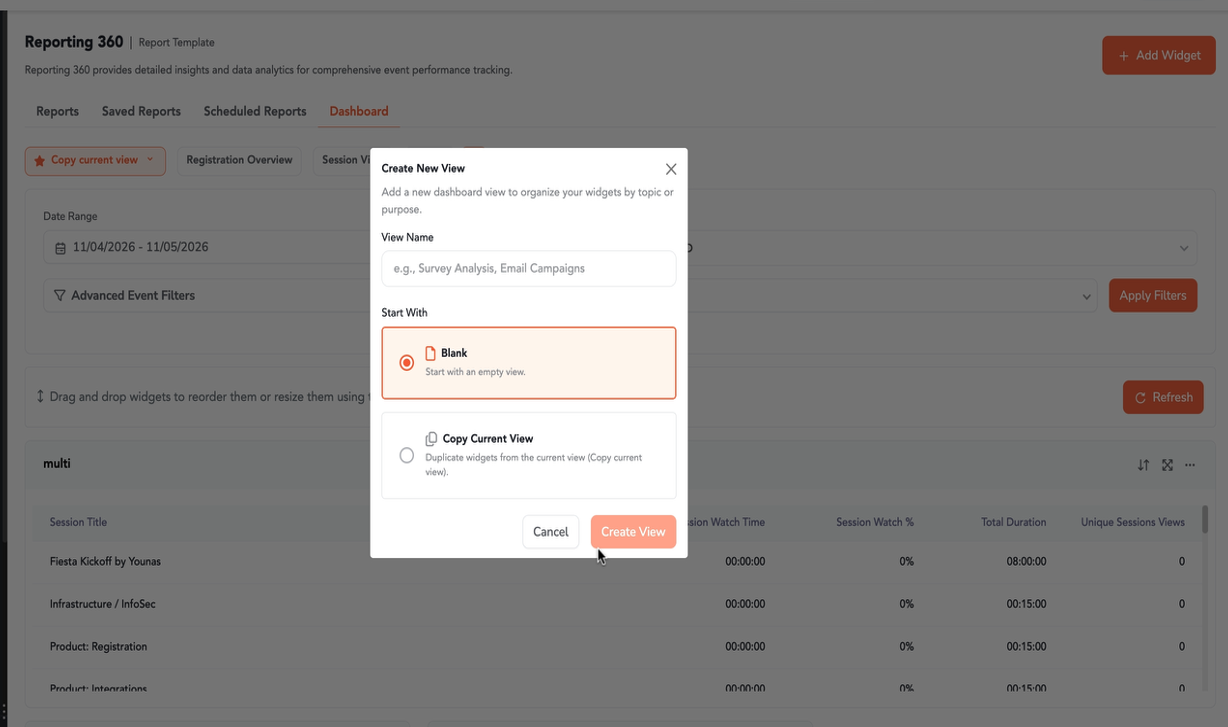
Step 15: To manage an existing view, click the dropdown arrow next to the view's name (e.g., Session View). From the dropdown, you can Rename, Duplicate, Set as Default, or Delete the view.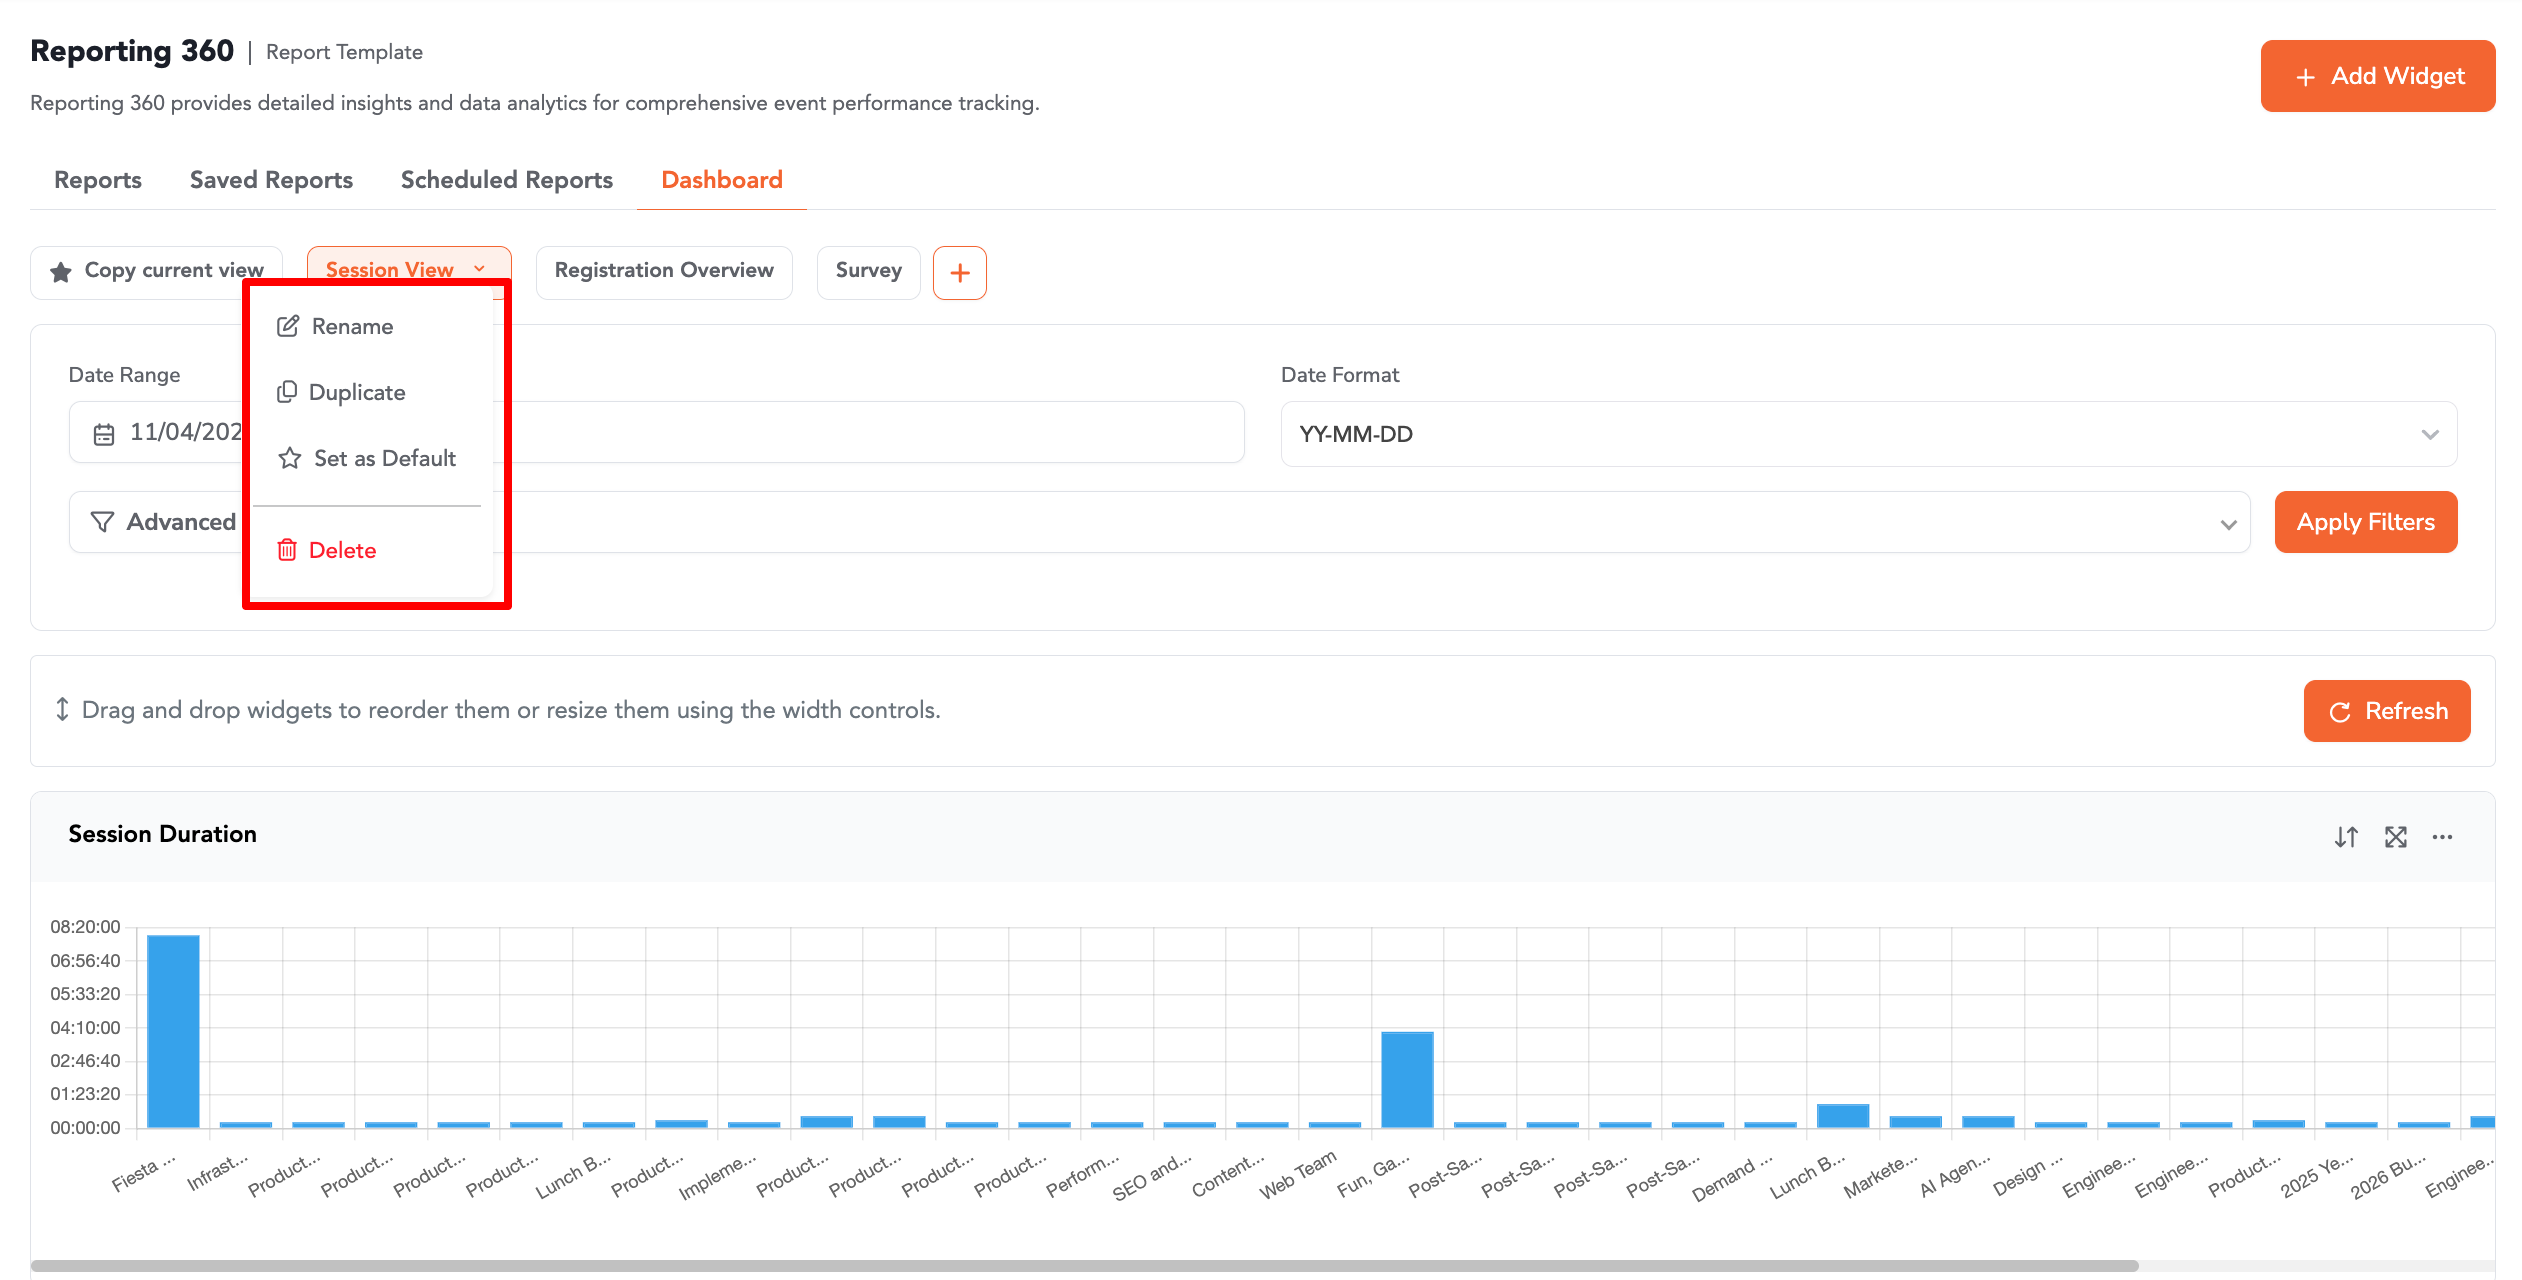
Important Notes
Widgets can be dragged and dropped to reorder them, or resized using the width controls.
Remember to click Refresh after making changes to filters or widgets to ensure your data is up-to-date.