Overview
Understanding booth performance is critical for measuring engagement, team effectiveness, and attendee interest. The Overall Booth Stats Report in the exhibitor portal provides a comprehensive summary of booth activity — from views and visits to document downloads and job applications.
Steps to View Overall Booth Stats
Step 1: Log in to the Exhibitor Portal
-
Use your exhibitor credentials to access the Exhibitor Dashboard for your event.
Step 2: Navigate to the Reporting Section
-
From the left navigation menu, click on “Reporting”.

Step 3: Select Report Type
-
In the Report Type dropdown, choose “Overall Booth Stats”.
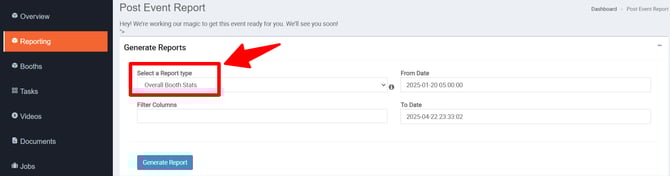
Step 4: Generate the Report
-
Click the “Generate Report” button to display a summary of booth-level analytics.
What the Report Includes
-
Total Booth Views
-
Number of Unique Visitors
-
Number of Chats Initiated
-
Document Downloads
-
Video Views
-
Job Applications Submitted (if enabled)
Pro Tips
-
Use these insights to identify peak engagement hours and high-performing content.
-
Compare booth stats across different days to evaluate marketing effectiveness.
-
Use data to prepare post-event summaries or ROI reports for internal stakeholders.